What actually speed up your A/B Test

We all want to speed up our A/B tests and run them as fast as possible. That means we’ll get insights faster, scale the solutions that drive impact quicker, and ultimately create business impact sooner.
But how exactly can we do it?
Let’s remind ourselves of the formula for sample size:
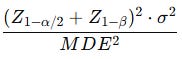
There are only three levers to reduce the sample size:
Change the variance
Change the error level
Change the Minimum Detectable Effect (MDE)
Let’s dive into the methods that actually move the needle.
1. Change the Minimum Detectable Effect (MDE) directly
The smaller the effect you want to detect, the larger the sample you need.
If you want to catch tiny changes, you’ll wait months.
If you’re okay only detecting big shifts, you’ll finish much faster.
👉 Example: detecting a 0.1% uplift in conversion might need millions of users. But if your MDE is 1%, you’ll wrap things up 100x sooner.
For startups, you don’t need to detect a 0.001% effect—your growth should be steep, and there are plenty of low-hanging fruits. Speed matters more than ultra-precision.
For mature companies, it’s the opposite: you’re looking for smaller uplifts because exponential growth is no longer possible, and small improvements compound significantly.
Rule of thumb: don’t aim for microscopic wins unless they really matter to the business.
2. Increase Your Error Level
Statisticians hate this one, but it works.
Most teams default to 95% significance (α = 0.05).
But what if you’re okay with 90% (α = 0.10)?
👉 Use this when:
The decision isn’t mission-critical.
You’re running early explorations.
You can re-run later for more precision.
Remember, it’s a trade-off: more speed, slightly higher risk of false positives.
Rule of thumb: only use this if there are no better options left.
3. Use Another Metric
Some metrics are naturally noisy (e.g., revenue per user). Others are cleaner (e.g., conversion rate, click-through).
If you want speed, choose a lower-variance proxy metric that’s still tightly linked to your business goal.
Example: Instead of testing impact directly on LTV (which is long-term, high variance), test on 7-day retention or ARPU at 14 days.
👉 The trick: pick a leading indicator that balances signal and speed.
This is why companies need a metric hierarchy—a clear understanding of which metrics are leading indicators and which ones are lagging. Without it, you’ll end up measuring what feels intuitive rather than what’s both fast and useful.
4. Decrease Variance
This is where the real magic happens. Lower variance means you need fewer users for the same level of confidence.
Here are the tools in your toolbox:
a) Outlier Removal
Extreme values can balloon variance (especially in revenue data). By trimming the top/bottom 1–5%, you tighten distributions without losing much signal.
But be careful—if you define “outliers” incorrectly, you might accidentally cut out a meaningful customer segment and bias your results.
b) Stratification
Instead of lumping everyone together, break users into groups (e.g., by country, traffic source, or device). This ensures balanced comparisons and reduces noise.
There are two main flavors:
Pre-stratification: ensuring randomization is balanced across groups before the test starts (e.g., equal split of mobile vs. desktop).
Post-stratification: reweighting results after the test to correct imbalances that appeared by chance.
👉 Caveat: stratification works best for small sample sizes. As your experiment grows, randomization naturally balances groups, and the benefit of stratification fades toward zero.
c) CUPED (Controlled Pre-Experiment Data)
CUPED is one of those techniques that feels like magic the first time you see it in action. It was introduced by Microsoft researchers, and it works by using pre-experiment data to reduce noise in your experiment.
Here’s the idea:
For most metrics, user behavior before the experiment strongly predicts behavior during the experiment.
Example: If a user spent $100 last month, they’re more likely to spend a lot this month too, regardless of which variant they’re in.
That prior information is not related to the treatment, but it explains part of the variance in outcomes.
CUPED uses this historical data as a covariate adjustment in the analysis. Essentially, it says:
“Let’s control for what we already know about a user so we can focus only on the treatment effect.”
👉 Why it helps: By explaining away the variance that comes from user history, the leftover “unexplained variance” is smaller. That means fewer users are needed to reach significance.
In practice, CUPED can reduce variance by 20–40% depending on the metric and how predictive past behavior is.
d) VWE (Variance-Weighted Estimator)
Keep reading with a 7-day free trial
Subscribe to Data Marks to keep reading this post and get 7 days of free access to the full post archives.